|
|
|
|
|
||||||||
|
|
||||||||||||
LESSON 4:
Transformations of Trigonometric Functions

Transformations
of y = sin x and y = cos x :
![]()

|
x (radians) |
0 |
|
|
|
|
|
|
|
|
|
|
|
|
|
x (degrees) |
0 |
30 |
60 |
90 |
120 |
150 |
180 |
210 |
240 |
270 |
300 |
330 |
360 |
|
sin x (exact) |
0 |
|
|
1 |
|
|
0 |
|
|
-1 |
|
|
0 |
|
sin x (approx.) |
0 |
0.5 |
0.87 |
1 |
0.87 |
0.5 |
0 |
-0.5 |
-0.87 |
-1 |
-0.87 |
-0.5 |
0 |
![]()

|
x (radians) |
0 |
|
|
|
|
|
|
|
|
|
|
|
|
|
x (degrees) |
0 |
30 |
60 |
90 |
120 |
150 |
180 |
210 |
240 |
270 |
300 |
330 |
360 |
|
cos x (exact) |
1 |
|
|
0 |
|
|
-1 |
|
|
0 |
|
|
1 |
|
cos x (approx.) |
1 |
0.5 |
0.87 |
1 |
-0.5 |
-0.87 |
-1 |
-0.87 |
-0.5 |
0 |
0.5 |
0.87 |
1 |
The
graph of y = asin kx:
Review carefully lessons 3, 6 of Functions & Transformations. The same point mapping method will be applied to the trigonometric functions.
The
value of a determines the vertical
stretch or compression
and the amplitude.
If |a| > 1, there is a vertical
stretch factor a
If
|a| < 1, there is a vertical compression factor a
Amplitude
= |a|
The
value of k determines the horizontal
stretch or compression
and the period.
If |k| > 1, there is a horizontal
compression factor 1/k
If
|k| < 1, there is a horizontal stretch factor 1/k
![]()
Example 1: Sketch the graph of the basic
function ![]() Use transformations
to sketch
Use transformations
to sketch ![]() .
.

Solution: For ![]() , construct a table of values of key points and plot the
graph [blue]:
, construct a table of values of key points and plot the
graph [blue]:
|
x0 |
0 |
90 |
180 |
270 |
360 |
|
y |
0 |
1 |
0 |
-1 |
0 |

(x, y) -----------------------à ( ½ x, 3y)
Using
the mapping and the points from the table above we get points for the
transformed graph
(x, y)
-----------------------------à ( ½ x, y)
(0, 0)
------------------------à (0, 0)
(900,
1) ----------------------à (450, 3)
(1800,
0) ---------------------à (900, 0)
(2700
, -1) --------------------à (1350, -3)
(3600,
0) ----------------------à (1800, 0) [red graph
at left]
In radians, the points (see table
at top of page) would be:
(x, y)
-----------------------------à ( ½ x, y)
(0, 0)
------------------------à (0, 0)

Domain: The
smallest value for x is 0 and the largest is ![]() .
.
Hence ![]()
Range: The
smallest value for y is -3 and the largest is 3.
![]()
Amplitude: |a| =
3
![]()
The
graph of y = sin (x – d) + c :
Review carefully lessons 3, 6 of Functions & Transformations. The same point mapping method will be applied to the trigonometric functions.
The
value of d determines a horizontal
translation (shift) d
units to the right or left
y = sin (x – 300) yields
a shift of 300 right relative to y = sin x.
y = sin (x + 450) yields
a shift of 450 left relative
to y = sin x.
The
value of c determines a vertical
translation (shift) c
units up or down
y = sin x – 3 yields a shift of 3
units down relative to y = sin x.
y = sin x + 2 yields a shift of 2 units up
relative to y = sin x.
Example 2: Sketch the graph of the basic
function ![]() Use transformations
to sketch
Use transformations
to sketch ![]() .
.
 Solution: For
 ![]() , construct a table of values of key points and plot the
graph [blue]:
, construct a table of values of key points and plot the
graph [blue]:
|
x0 |
0 |
90 |
180 |
270 |
360 |
|
y |
0 |
1 |
0 |
-1 |
0 |
![]()
(x, y) -----------------------à (x + 300,
y + 2)
Using
the mapping and the points from the table above we get points for the
transformed graph
(x, y)
-----------------------------à (x + 300, y+2)
(0, 0)
------------------------à (300, 2)
(900,
1) ----------------------à (1200, 3)
(1800,
0) ---------------------à (2100, 2)
(2700 , -1) --------------------à (3000, 1)
(3600,
0) ----------------------à (3900, 2) [red graph
at left]
In radians, the points (see table at
top of page) would be:
![]()

Domain (for 1 cycle): The smallest value for x is 300 and the largest
is 3900.
Hence ![]()
Range: The
smallest value for y is 1 and the largest is 3.
![]()
Amplitude: |a| =
1
![]()
Definition: The horizontal translation is called the phase shift.
![]()
Example 3: Sketch the graph of the basic
function ![]() Use transformations
to sketch
Use transformations
to sketch ![]() .
.
 Solution: For
 ![]() , construct a table of values of key points and plot the
graph [blue]:
, construct a table of values of key points and plot the
graph [blue]:
|
x0 |
0 |
90 |
180 |
270 |
360 |
|
y |
1 |
0 |
-1 |
0 |
1 |
![]()
(x, y) -----------------------à (x – 600,
y – 1)
Using
the mapping and the points from the table above we get points for the
transformed graph
(x, y)
-----------------------------à (x – 600,
y – 1)
(0, 1)
------------------------à (-600, 0)
(900,
0) ----------------------à (300, -1 )
(1800,
-1) ---------------------à (1200, -2)
(2700 , 0) --------------------à (2100, -1)
(3600, 1) ----------------------à (3000, 0) [red graph at left]
In radians, the points (see table
at top of page) would be:
![]()
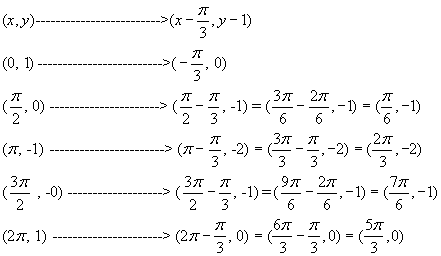
Amplitude: |a| =
1
![]()
![]()
Combinations
of Transformations -- y = a sin k(x
– d) + c and y = a cos k(x – d) + c
Example 4: Sketch the graph of the basic
function ![]() Use transformations
to sketch
Use transformations
to sketch ![]() .
.
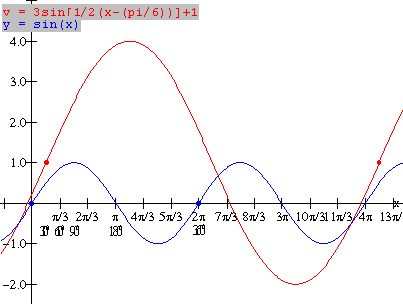
Solution: For ![]() , construct a table of values of key points and plot the
graph [blue]:
, construct a table of values of key points and plot the
graph [blue]:
|
x0 |
0 |
90 |
180 |
270 |
360 |
|
y |
0 |
1 |
0 |
-1 |
0 |

(x, y) -----------------------à (2x + 300, 3y + 1)
Using
the mapping and the points from the table above we get points for the
transformed graph
(x, y) -----------------------------à (2x + 300,
3y + 1)
(0, 0)
------------------------à (300, 1)
(900, 1)
----------------------à (2100, 4)
(1800, 0)
---------------------à (3900, 1)
(2700 , -1)
--------------------à (5700, -2)
(3600, 0) ----------------------à (7500, 1) [red graph at left]
In radians, the points (see table
at top of page) would be:
![]()
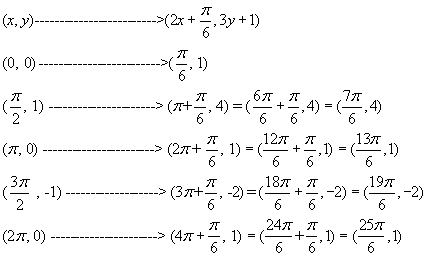
Amplitude: |a| =
3

![]()
Domain of 1 period or cycle
(between red dots on graph):
![]()
Range: The maximum value of y is 4 and the
minimum value is –2
![]()
Example 5: Sketch the graph of the basic
function ![]() Use transformations
to sketch
Use transformations
to sketch ![]() .
.
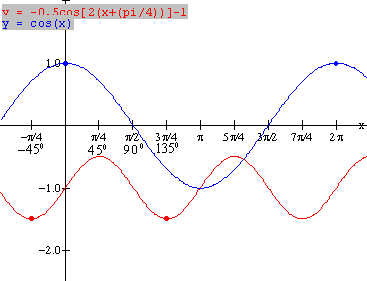
Solution: For ![]() , construct a table of values of key points and plot the
graph [blue]:
, construct a table of values of key points and plot the
graph [blue]:
|
x0 |
0 |
90 |
180 |
270 |
360 |
|
y |
1 |
0 |
-1 |
0 |
1 |

(x, y) -----------------------à ( ½ x – 450,
- ½ y – 1)
Using
the mapping and the points from the table above we get points for the
transformed graph
(x, y) ------------------------------à( ½ x – 450,
- ½ y – 1)
(0,
1) -------------------------à (-450, -1.5)
(900, 0)
-----------------------à (00, -1 )
(1800, -1)
---------------------à (450, -0.5)
(2700 , 0)
---------------------à (900, -1)
(3600, 1)
----------------------à (1350, -1.5) [red graph
at left]
In radians, the points (see table
at top of page) would be:
![]()
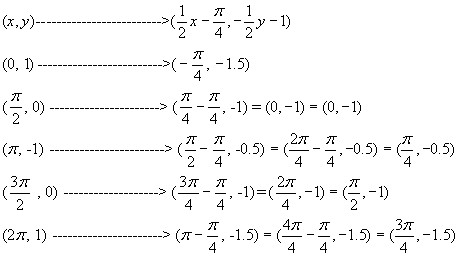
Amplitude: |a| =
½
![]()
![]()
Domain of 1 period or cycle
(between red dots on graph):
![]()
Range: The maximum value of y is -0.5 and
the minimum value is –1.5
![]()
![Text Box: In summary, to graph y = a sin [k(x – d)] + c from the graph of y = sin(x), follow these ideas:
· If a < 0, we have a reflection in the x-axis
· If k < 0, we have a reflection in the y-axis
· If | a | < 1, we have a vertical compression , factor | a |
· If | a | > 1, we have a vertical stretch, factor | a |
·
· If | k | < 1, we have a horizontal stretch, factor 1/k
· If | k | > 1, we have a horizontal compression, factor 1/k
· The value of d gives the horizontal translation (phase shift)
· The value of c gives the vertical translation (shift)](./trans_files/image170.gif)


